
Optimization
Comparing Designs
How to compare optimization results across molds and select the best design.
Comparing Designs - The Design Matrix
Results Chart
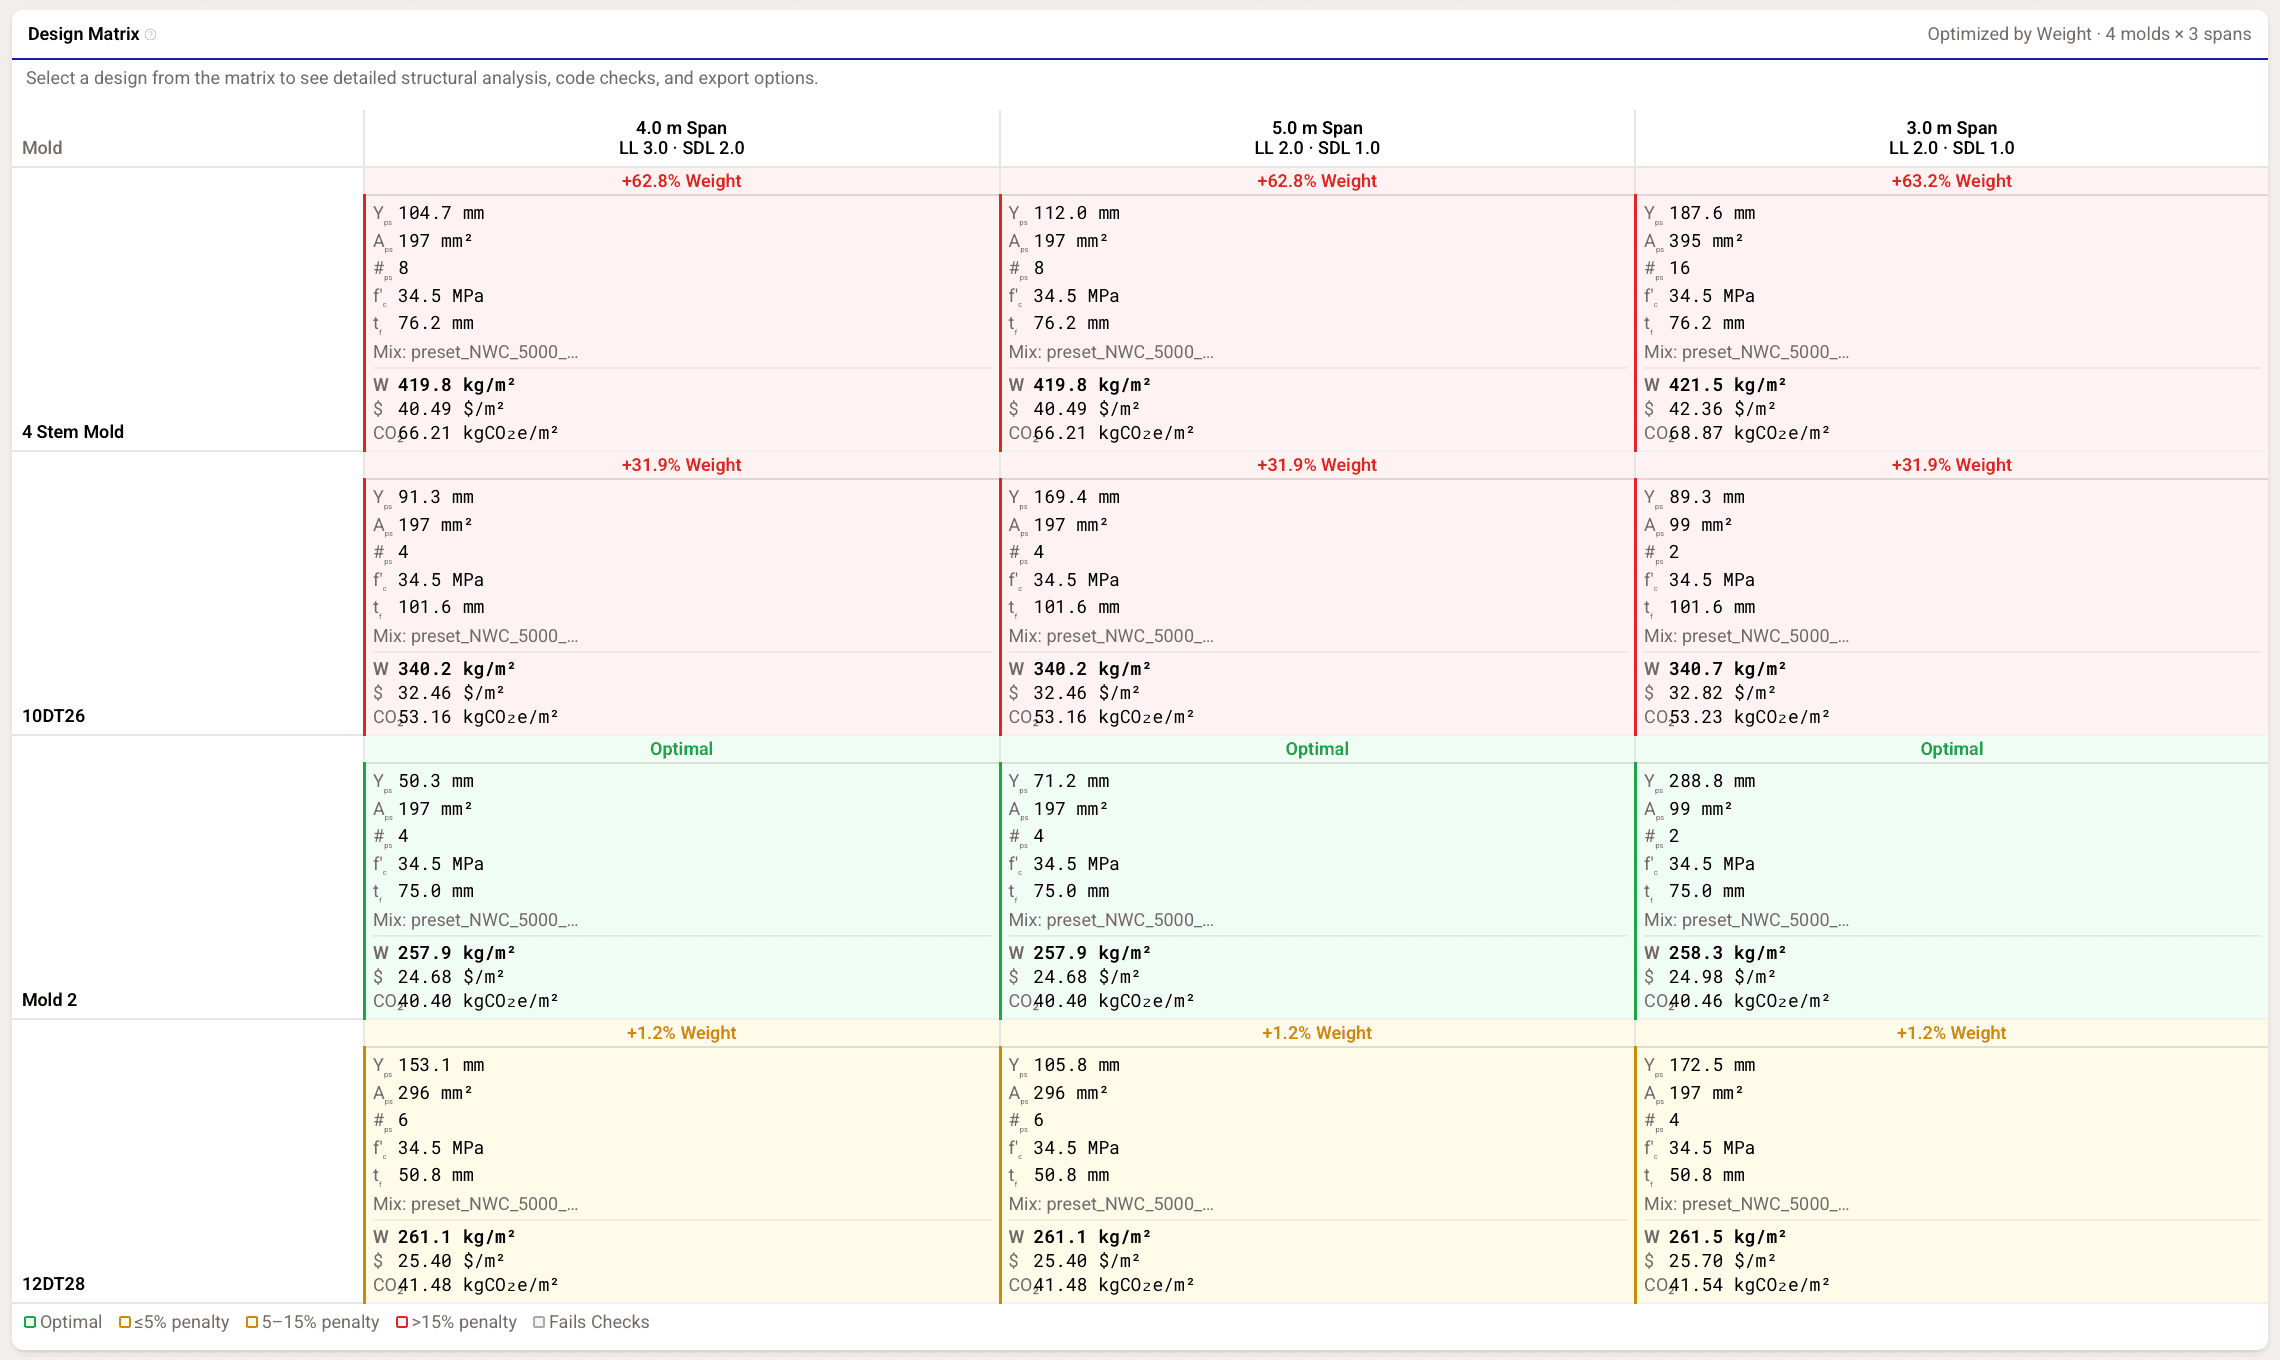
After optimization, Cimbra displays results as Design Matrix where:
- Each row represents a selected mold
- Each column represents a span/load condition
- Each cell represents a design generated by Cimbra
- Cells are color coded. Green represents best feasible designs, yellow and red are lower performing, but still feasible designs. Infeasible designs will not be shown
Using the Design Matrix
- Click a cell to load its full structural verification, which will be displayed below the Design Matrix.
The Design Matrix helps you make an informed selections when multiple designs are viable — for example, comparing a lighter design against a cheaper one that uses a mold you already own.